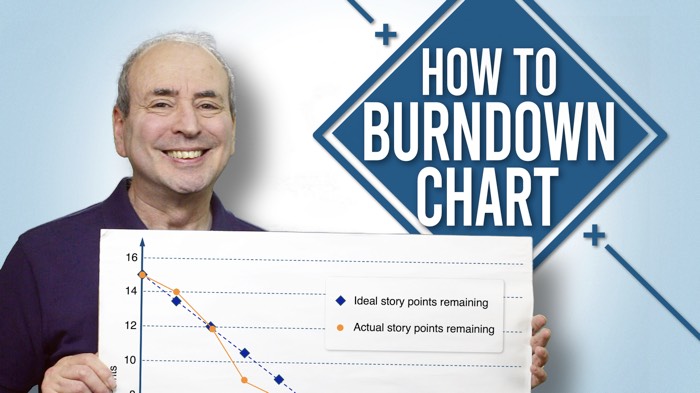
A Burndown chart is a way to visualize progress. It plots outstanding work against time. So, as you make progress, the work outstanding diminishes, giving the characteristic downward slope of a burndown chart. But, how can you build your own?
This video is safe for viewing in the workplace.
This is learning, so, sit back and enjoy
Creating a Burndown Chart
Instead of plotting outstanding work, we could also plot work completed against time. Now, as you make progress, the work completed increases, to give the characteristic upward slope of a burnup chart.
I discuss the two types of burn chart in my video, What are a Burndown Chart, a Burnup Chart, and Velocity? In this video I will describe how to create a burndown chart. But creating a burn-up chart is very similar.
1. Define the Scope and Time Frame
Determine whether your burndown chart will be a:
- Sprint burndown (short-term
- Release burndown (multi-sprint), or
- Epic burndown.
Then, set the time frame. For a sprint burndown, use the duration of the sprint (e.g., 10 working days for a 2-week sprint).
2. Choose the Measurement Unit
Common units include story points, hours, or number of tasks. Ensure the team consistently uses the chosen unit during planning and estimation.
3. Establish the Total Workload
From the sprint backlog, calculate the total number if story points or estimated hours for all committed backlog items. If using hours, ensure task breakdown and time estimation are completed.
4. Set Up Your Data Collection Method
Use a tool that supports daily updates and visual tracking:
- Manual tools include Excel, Google Sheets.
- Automated tools include Jira, Trello, Azure DevOps
5. Create the Chart Structure
Put time on the x-axis – usually days. Put effort remaining on the y-axis – in story points, tasks, or hours. Then, format your chart with grid lines and labels.
6. Plot the Ideal (Guideline) Line
Draw a line from the top left (Day 1, total effort) to the bottom right (last day, 0 effort). This represents the ideal rate of progress—a perfect, linear burn.
7. Update the Chart Daily with the Actual Progress Line
In the Daily Scrum, calculate the actual remaining effort. Subtract the story-point value or hours logged for completed items. Plot each point at the end of the day and connect with a line. This shows how the team is progressing in comparison to the ideal.
8. Analyze and Interpret Trends
If your actual is above the ideal line, you are behind schedule. And if it is below the ideal line, you are ahead of schedule. Watch for plateaus or spikes, which may indicate impediments, underestimation, or scope creep.
9. Use the Chart for Manage the Work
Make the chart visible, as a communication and management tool, in team areas or on dashboards. Facilitate discussions during stand-ups and retrospectives. Ask things like: ‘What’s slowing us down?’ or ‘What helped us gain speed?’
10. Customize for Your Chart
As you use it, tailor the tool based on team maturity and stakeholder needs, adding features like:
- Annotations (e.g., blockers, holidays)
- Conditional formatting (e.g., red for missed burn targets)
- Cumulative flow or velocity indicators
Archive and Review
At the end of the sprint, release, or epic:
- Discuss what it shows, the Sprint Retrospective—how accurately did we estimate? Use data to improve planning and estimation next time.
- File the chart for historical comparison. It will make great input for AI estimation.
See also…
My complementary video, Use a Burndown Chart to Spot Problems | Top 7 Burndown Chart Anti-patterns (available from 21 August, 2025.
What Kit does a Project Manager Need?
I asked Project Managers in a couple of forums what material things you need to have, to do your job as a Project Manager. They responded magnificently. I compiled their answers into a Kit list. I added my own.
Check out the Kit a Project Manager needs
Note that the links are affiliated.
Learn Still More
For more great Project Management videos, please subscribe to the OnlinePMCourses YouTube channel.
If you want basic Management Courses – free training hosted on YouTube, with 2 new management lessons a week, check out our sister channel, Management Courses.
For more of our Project Management videos in themed collections, join our Free Academy of Project Management.
For more of our videos in themed collections, join our Free Academy of Project Management.

